CVA Features
Efficient Data Analysis,
modeling, prediction
and optimization
CVA Features
Efficient Data Analysis,
modeling, prediction
and optimization


Visualize data and gain insights
Support exploratory data analysis, i.e. visualization and initial analysis of data.
Definition of value ranges and restrictions
- Histograms
- Scatterplots
- Boxplots for data distribution analysis
- Automatic outlier detection
- Calculation and visualization of correlations
- Suggestion of variable transformations to support modeling
- Extensive reporting functions (export of graphs)
- Processing of mixed integer and categorical or partially missing data values
- Grouping of variables by group-wise declaration of restrictions

Optimally plan new experiments
Module for real or simulation-based experiments to systematically generate a set of experiments. All common methods of experiment design as well as advanced special approaches, such as space-filling, are available. The procedure makes it possible to use already existing experimental data to identify optimal parameter settings with only a few additional experiments.
Procedure for the creation of experimental designs:
- Fractional factorial
Plackett-Burman
- Box-Behnken
- D-optimal
- Export to Excel and back for direct processing
- Latin Hyper Squares
- Space-filling
- Consideration of restrictions
- Sobol

Automatically generate, understand and use the best possible model
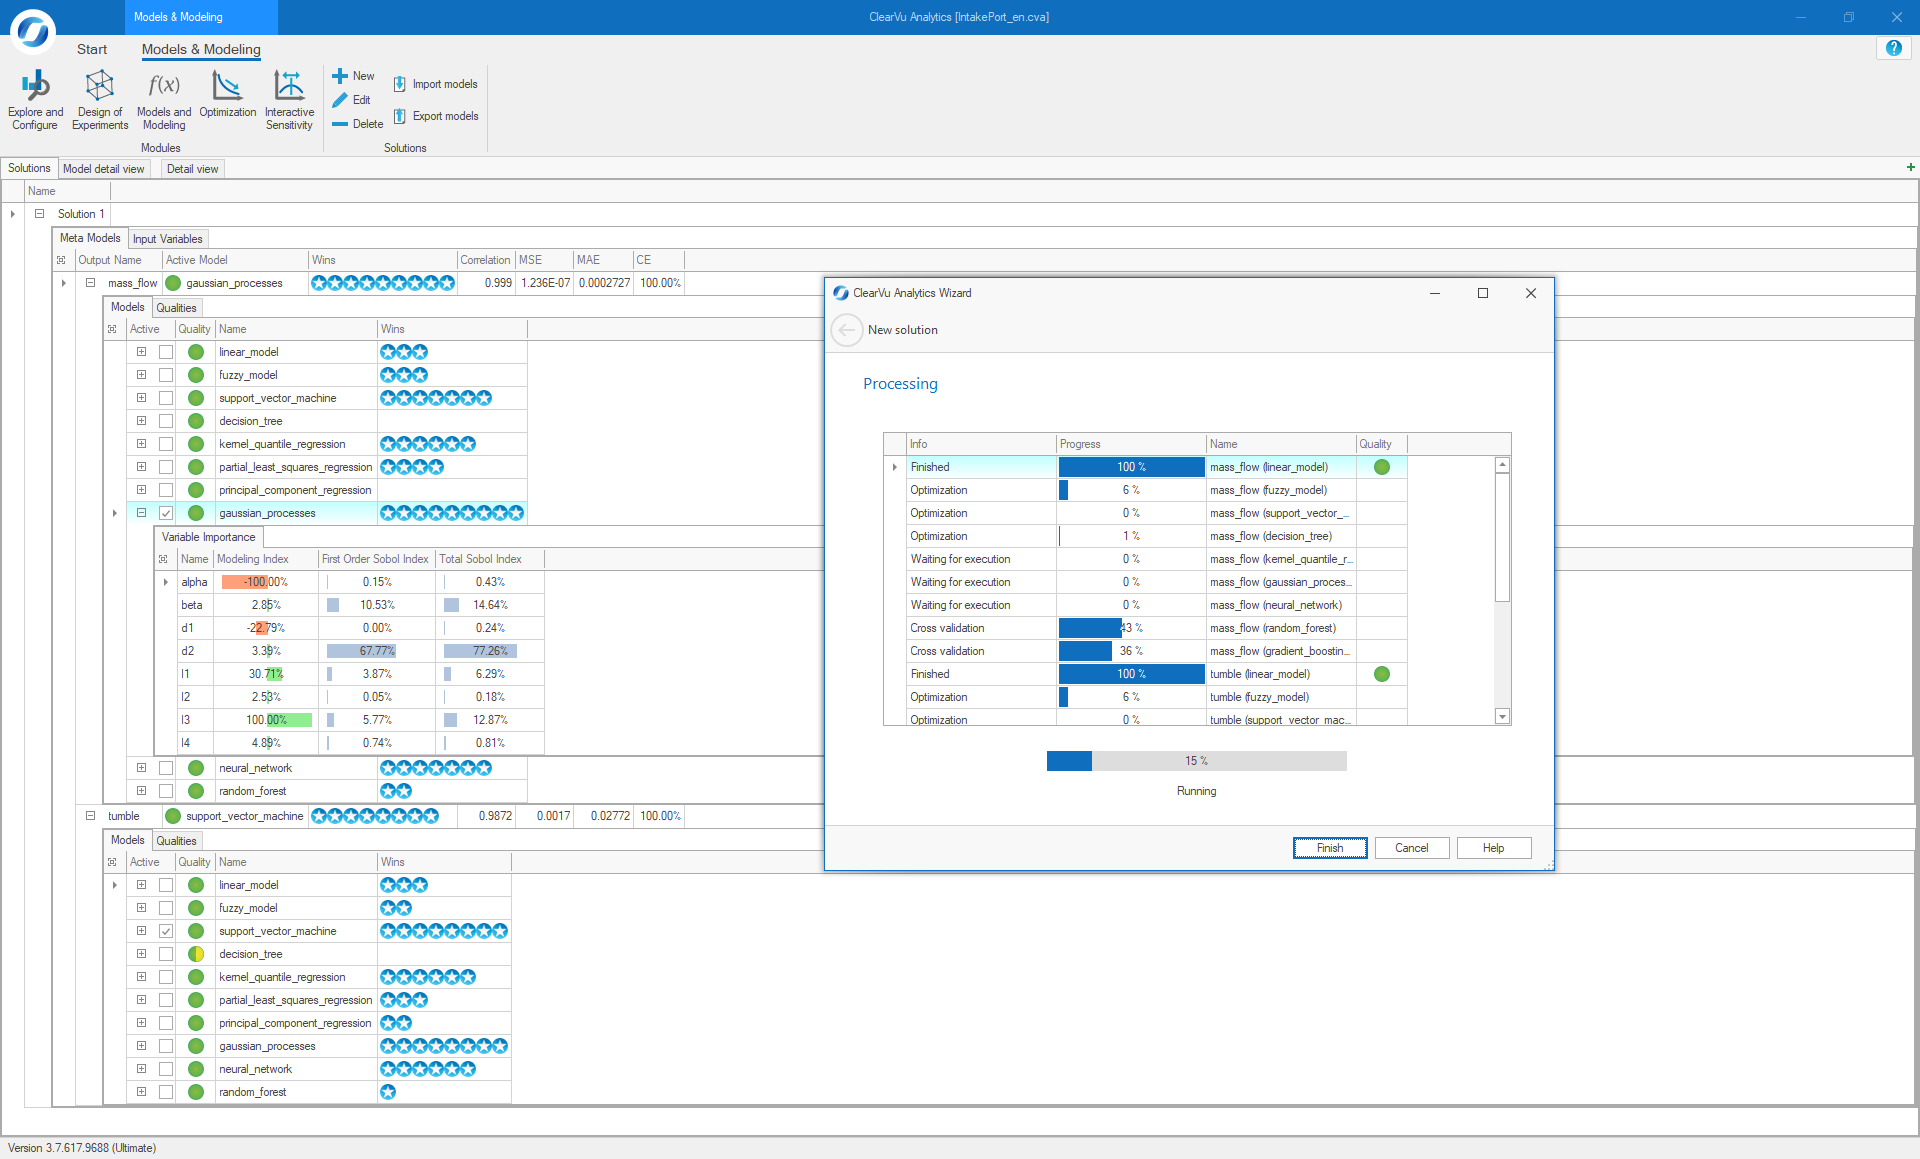
Automatically generate models from data using a variety of (nonlinear) modeling procedures. For all procedures, the hyperparameters are automatically optimized, finding the best possible cross-validated model.
- Avoidance of overfitting through cross-validation of the models
- Easy recognition of the best model through traffic light result display
- Direct application of the models for forecasts, sensitivity analyses or optimization
- Determination of a confidence measure for all model types
Excerpt of the methods for modeling:
- Linear Models
- Support Vector Machine
- Fuzzy models with rule inspection methods
- Decision trees
- Ensembles of decision trees (“random forests”)
- Neural Networks (MLP, feed-forward)
- Gaussian processe
- Partial least squares regression (PLS)
- Principal component regression
The best model obtained from automatic optimization can be further used and analyzed in many ways:
- Model based forecast
- One and two dimensional sensitivity analysis
- Diagrams for three-dimensional sensitivity analysis
- Model inspection for suitable modeling procedures
- Determination of parameter influences via Sobol indices
- Reduction of parameter space via dendrograms
- Manifold visualizations
- Automatic variable selection – hierarchical clustering for complexity reduction
- Linear models with automatic structure generation of the models, possibility of user-defined terms
- Variable selection for linear models with forward and backward selection
- Hyperparameter optimization for all model types
- Calculation of various quality criteria for the model quality
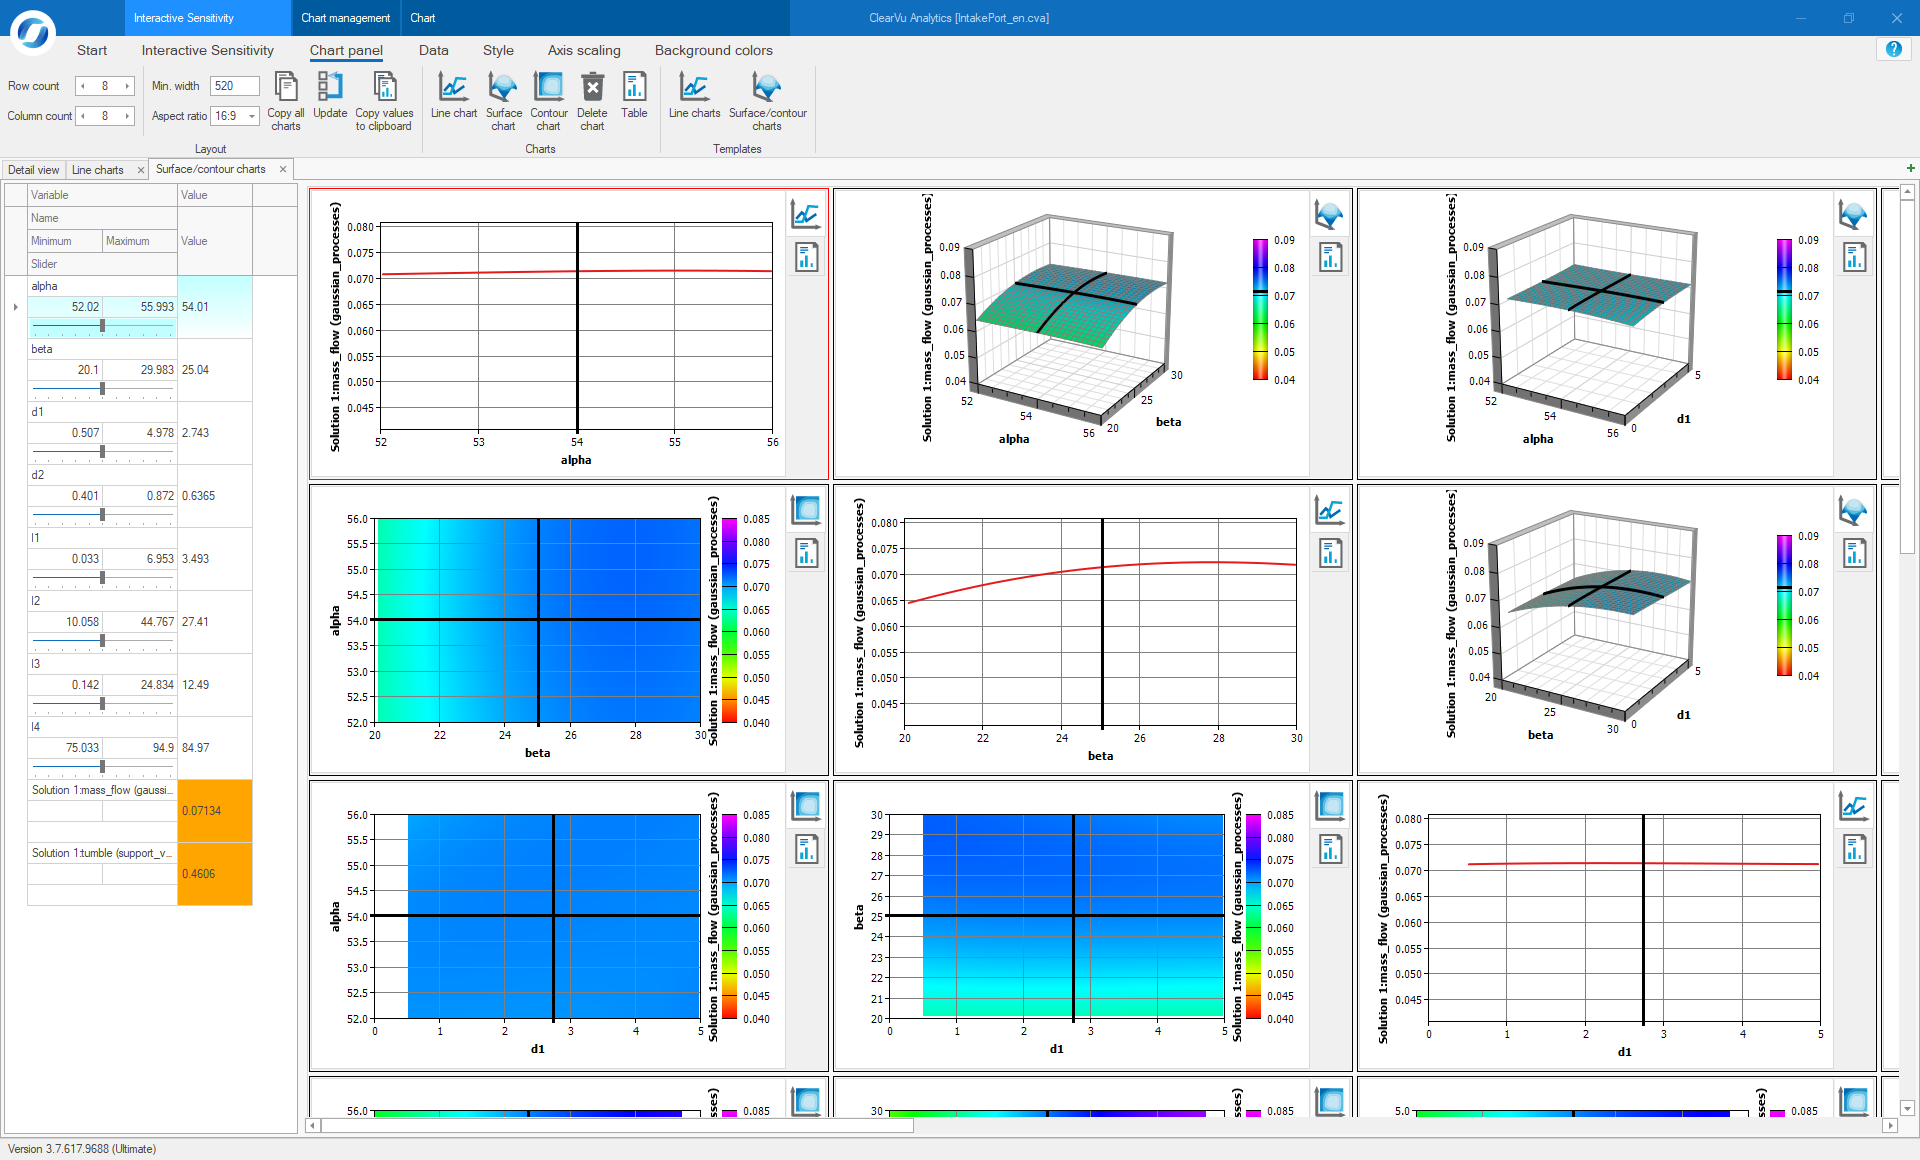
- Sensitivity analysis of the models as interactive 2-D and 3-D surface plots

Forecasting optimal products/processes
Optimizations can be performed, for example, for an optimal process condition or an optimal product design. Multiple, conflicting target criteria can also be considered. Minimization and maximization tasks, the achievement of a target value or the fulfillment of an inequality (restriction targets) are also possible.
Features:
- Use of models for the formulation of target criteria
- Maximization, minimization and goal value achievement
- Mixed-integer optimization
- Multiple, even opposing objectives are possible through Pareto optimization
- Comprehensive inspection of optimization results through graphical visualization
- Objective function editor – objective functions can be formulated as mathematical expressions using model outputs
- Restriction editor – restrictions on the objective functions can be formulated in general terms; including consideration of algebraic restrictions
- Advanced evolution strategies for identifying best possible solutions in high-dimensional multimodal search spaces
- No prior knowledge required to perform optimization

Understand and control the influences of parameters
Interactively vary influencing parameters using sliders and visualize them immediately in response to the variation. Output ranges can be individually colored for a model, making it easier to identify “good” and “bad” areas. This is particularly useful in rapid prototyping, as it allows interactive experimentation with the real system represented by the model.
Features:
- Exploration of models through interactive parameter variations
- Parameter variations adjustable via sliders
- Application for both regression models and classification models
- Simple, visual and fast evaluation for planned experiments
- Display of the sensitivity of individual parameters
Use batch mode for many models
With the Command Line add-on module, you can use ClearVu Analytics without a graphical user interface. This allows thousands of models to be quickly calculated on clusters in batch mode. Frequent model updates are also available efficiently in this way. This approach is particularly useful when numerous output variables are to be modeled or data sets change frequently.
- Use of all components (modeling, optimization) as command-line calls (without GUI)
- Design of experiments, modeling and optimization in batch mode
Contact
How to contact us
Telephone
+49 231 97 00 340
Address
Joseph-von-Fraunhofer-Straße 20,
44227 Dortmund, Germany


